According to the experts, the movement of stocks is supposed to be random. But if you look at the stock market over the last 68 years there’s one little-known pattern in there, recurring every four years, that has consistently given the lie to the pundits. It doesn’t exactly jump out at you, but if you look carefully, there, indeed, it is, hiding in plain sight like Waldo. Every four years, there’s a period of about six months which has always had a positive return, one hundred percent of the time, and at times a pretty good one.
Nobody, as far as one can tell, has come up with an explanation. But it has happened every mid-term election for as far back as I’ve looked (which is to 1950).
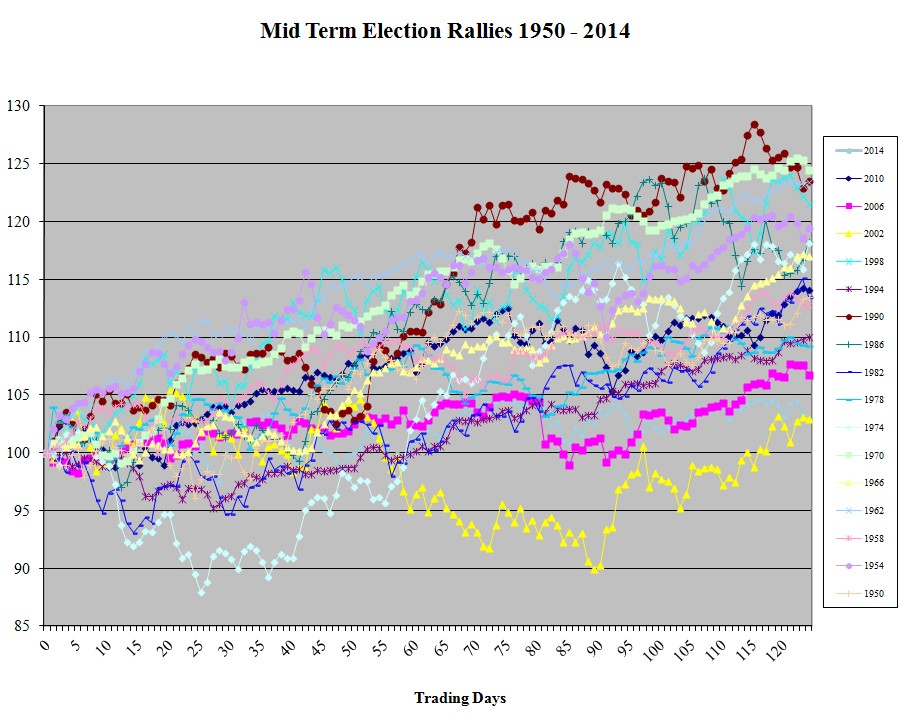
Here’s a chart showing how the S&P 500 (a broad-based stock market index) has behaved in the days after the mid-term elections going back to 1950.

The starting point for each of the 17 midterm rallies shown in the chart is the day before the election, more or less (I might be off by a day or two in some cases). To make them comparable, the prices are shown as a percentage of the price on Day 1.
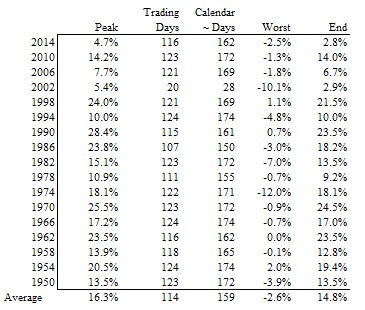
In every single case, if you wait for 124 trading days (which takes you into early May), there is a positive return. The table below shows the high point for each rally (the peak percentage return, and how many days out it was), the point of peak remorse if you had put your money in on Day 1, and the return after 124 trading days (that’s as far out as I looked, having eyeballed the charts to more or less fit the story). The average return for these 17 rallies is almost 15%.

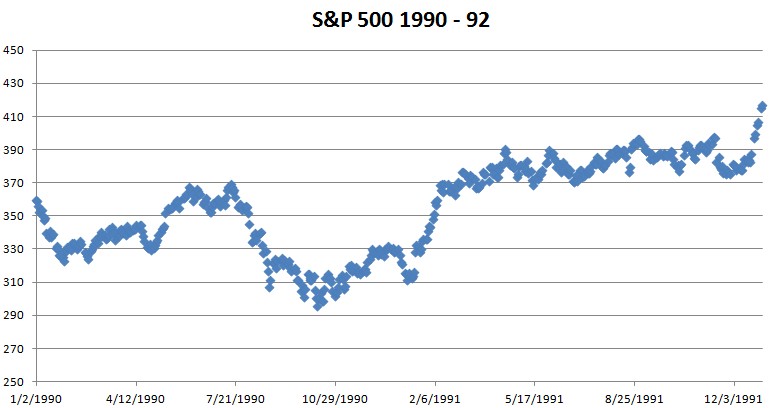
The best year of the lot was 1990, when you could have cashed out for a 28% gain if you’d been lucky enough to take everything off the table on April 17th, 1991. Of course, it didn’t hurt that Saddam Hussein had invaded Kuwait in August 1990, thereby provoking a substantial selloff going into the midterms, nor that by February he had had his ass kicked and retreated in confusion back to Baghdad.

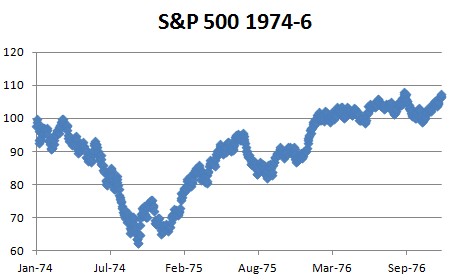
1974 would have been the worst in terms of frayed nerves. Nixon resigned in August, and by September the market had dipped to levels not seen since the early 1960s. There was a bit of recovery going into the midterms, when the Democrats made big gains in the House, Senate and Gubernatorial races, but if you’d bought the day before the election you would have been down about 12% by December 6th and kicking yourself for an idiot.

Not to worry, though: the pattern held and if you’d hung in there you would have ended up with a very respectable 18% gain.
Having watched this for about six cycles and dogged myself for not having had the nerve to make a bet each time, I at last took the plunge in the midterms of 2010 and 2014. For these relatively small returns, you need to put a good chunk of money to work in order to make a decent amount in dollars. As one who is permanently convinced that the world is about to fall apart, I had to grit my teeth and take my courage in both hands. I took my money off the table with a 13.6% return in February 2011 and a measly 6.2% return in early April 2015.
They say you can also predict the stockmarket by following butter production in Bangladesh, or something like that. In other words, the fact that this has worked in every single midterm since 1950 does not mean it will work again in the next few months after the upcoming midterms. I, for one, am much too scared by the high valuation of the market and the imminent apocalypse to take the plunge this time, unless there is a substantial drop in the market between now and November 5th. Caveat emptor.
Oliver Corlett, oeconoclast


